You're spending thousands on marketing every month. Your website looks good. You're posting on LinkedIn. Maybe running some Google Ads. But here's what comes up in every partner meeting: is this actually working?
Most small professional service firms treat marketing like a black box. Money goes in, and you hope clients come out. Here's the problem. You can't fix what you don't measure. The firms that grow aren't spending more on marketing. They're just watching the right numbers and making better decisions. This guide shows you exactly which marketing metrics to track each month and what good numbers actually look like for law, accounting, and finance firms.

Why Monthly KPI Tracking Matters for Professional Service Firms?
Think about how you run client work. You wouldn't take on a matter without clear milestones, right? Your marketing deserves the same treatment. Monthly tracking does three things. First, it shows you what's actually working, not what you think is working. Second, it catches problems early. Like when your website traffic drops 40% and nobody notices for three months. Third, it gives you confidence to spend more on what works and cut what doesn't. Only 36% of professional service firms are truly data-driven in their decision-making. But those firms consistently outperform competitors in growth and profitability. The advantage is there. You just need to look at your numbers honestly.
Understanding Marketing Metrics Through Your Client Journey
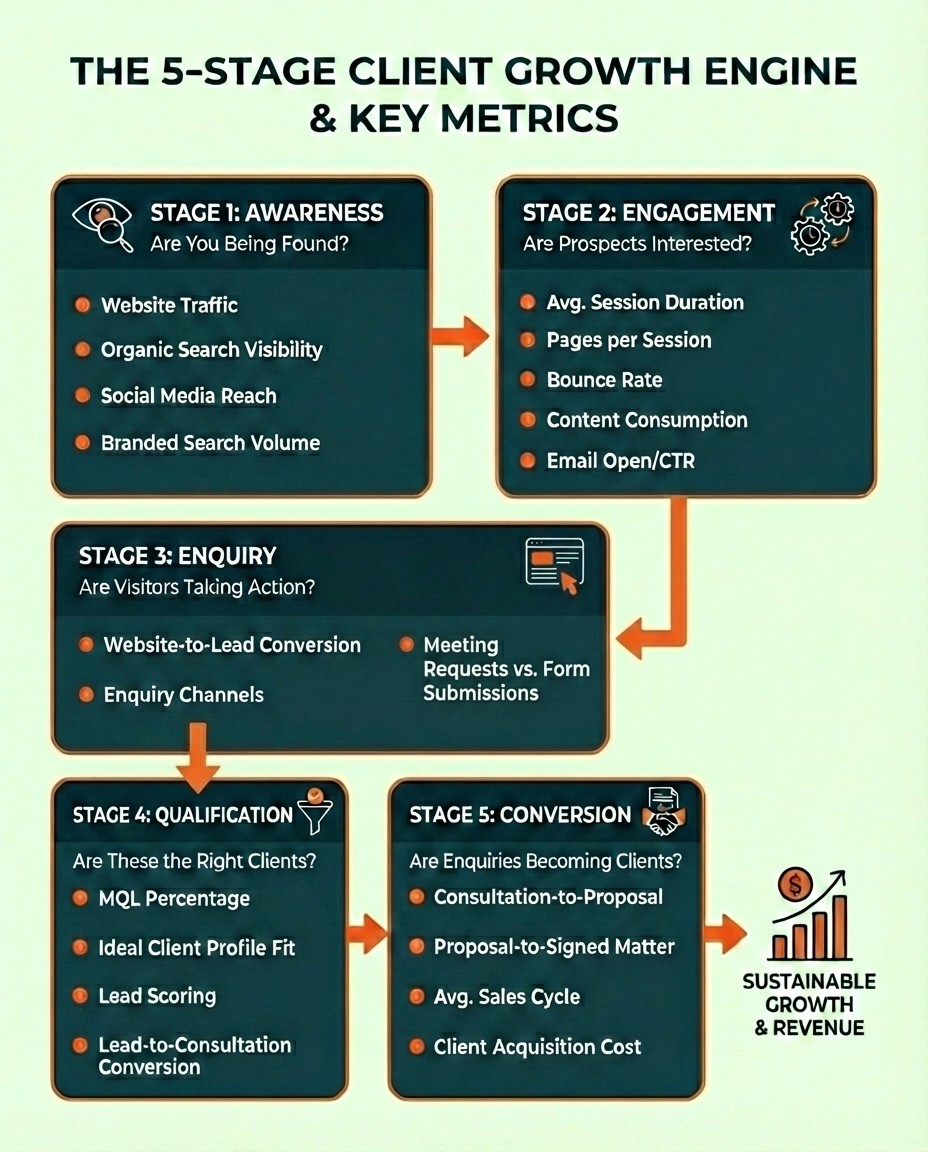
Your marketing funnel isn't a straight line. Potential clients move through stages. And at each stage, different digital marketing metrics tell you what's happening. Most firms only measure the top (website traffic) and bottom (new clients). They miss all the signals in between that show where things are breaking.
Stage 1: Awareness Metrics - Are You Being Found?
Before someone can hire you, they need to know you exist. Awareness metrics show whether your firm shows up when potential clients are looking. Website traffic is your baseline. How many people visit your site each month? Small professional service firms (under 100 employees) typically see 500 to 2,000 monthly visitors, depending on your market and specialty. But where that traffic comes from matters more than the total number.
Organic search visibility is critical. Track how many people find you through Google searches versus typing your firm name directly. A healthy firm gets 60-70% of traffic from non-branded searches. That means people finding you when searching for services, not because they already know your name. If most of your traffic is branded, you're not getting discovered by new prospects. Social media reach tells you if your thought leadership resonates. Professional services lag other industries in engagement rates. That's normal. The buying cycle is longer. Don't expect viral numbers. What you want is steady follower growth from people in your target market and consistent engagement from decision-makers. Track whether more people search for your firm name over time. That signals your marketing and reputation are building momentum. Awareness isn't about immediate conversions. It's about building an audience who'll remember you when they need help.
Stage 2: Engagement Metrics - Are Prospects Interested?
Traffic means nothing if people leave immediately. Engagement metrics show whether visitors find your content valuable. Average session duration for professional service websites should be 2-4 minutes. Anything under 90 seconds means visitors aren't finding what they need. Pages per session should average 2-3 pages. That shows people exploring your expertise and services. Bounce rate is tricky. A 40-60% bounce rate is normal for professional services. Yes, nearly half your visitors look at one page and leave. That's okay. What matters is the right people staying and the wrong people leaving.
Track which content people actually read. Look at time on page for your key articles. Are people downloading your guides? Subscribing to your newsletter? Lead nurturing emails get 4-10 times better response than standard marketing emails. But only if people opted in because they valued your content. Email metrics matter. For professional services, aim for 20-25% open rates and 2-4% click-through rates. Significantly below this? Your email content isn't resonating or your list needs cleaning. Engagement separates browsers from serious prospects. High engagement means you're attracting people with real problems you can solve.
Stage 3: Enquiry Metrics - Are Visitors Taking Action?
This is where marketing turns into business development. Enquiry metrics measure how many visitors actually start a conversation. For professional services, this is one of your most critical conversion points. Website-to-lead conversion rate is your headline number. Industry benchmarks put this at 2-5% for professional services. Top performers hit 6-8%. So if you get 1,000 website visitors monthly, you should generate 20-50 leads. Well below this? Your website has problems. Unclear calls to action. Too many form fields. Content that doesn't prompt action.
Track which channels generate enquiries. Organic search. Paid ads. Referrals. LinkedIn. Email campaigns. Most firms are shocked when they see the real numbers. You might think Google Ads drive your business when actually 70% of quality enquiries come from organic search and referrals. Meeting requests and phone calls show higher intent than contact form submissions. Someone booking a consultation or calling directly is more serious than someone filling out a generic contact form. Track these separately. If enquiries are low, you have a marketing problem. If enquiries are high but conversions are low, you have a sales problem. Don't confuse the two.
Stage 4: Qualification Metrics - Are These the Right Clients?
Not all enquiries are equal. Some come from ideal clients with real needs and budgets. Others come from people who can't afford you or don't fit your expertise. Qualification metrics help you understand lead quality, not just quantity. Marketing Qualified Lead (MQL) percentage is the share of enquiries that meet your basic criteria. Right industry. Right company size. Right problem. Budget indicators. For professional services, typical MQL rates run 25-30% of total leads. If only 10% of your enquiries qualify, your marketing attracts the wrong audience. Or your messaging isn't clear about who you serve.
Use lead scoring to help. Assign points based on firmographics, behavior, and stated needs. Did they download your advanced guide or just subscribe to the newsletter? Did they mention a specific urgent problem or ask a vague question? Do they fit your ideal client profile? Track average lead quality scores over time. Lead-to-consultation conversion shows how many qualified leads make it to a discovery call. Benchmark this at 40-60% for professional services. Significantly lower? Something's breaking in your follow-up. Slow response times. Poor nurture sequences. Qualification criteria that's too loose. Marketing and business development need to work together here. Marketing brings qualified leads. Business development converts them. Both teams need to see these metrics.
Stage 5: Conversion Metrics - Are Enquiries Becoming Clients?
This is what everything builds toward. Turning qualified enquiries into signed engagements. These conversion metrics directly predict revenue, making them your most watched numbers. Consultation-to-proposal conversion measures how many initial meetings lead to formal proposals. For professional services, aim for 50-70%. Lower than this? Either you're not qualifying leads properly before meetings, or your discovery process isn't uncovering real needs and urgency. Some conversations won't progress. That's fine. But if less than half your consultations turn into proposals, you have a problem.
Proposal-to-signed matter conversion is your close rate. Industry data suggests 20-30% is typical, with strong performers hitting 40-50%. This varies by service type, complexity, and competition. Commodity services convert higher but at lower fees. Specialized advisory converts lower but commands premium rates. Average sales cycle shows how long from first enquiry to signed engagement. For most professional services, this runs 2-6 months depending on service complexity. Track this closely because extended cycles tie up resources and delay revenue. If your cycle is getting longer, it often signals weakening demand or increasing competition.
Client acquisition cost (CAC) is total marketing and sales expense divided by new clients. For professional services, your CAC should be under 20-30% of first-year client value. Spending $5,000 to acquire a client whose first engagement is worth $15,000? Your numbers don't work unless you have strong lifetime value. Understanding what defines a KPI for business growth helps you connect these conversion metrics to broader firm objectives.
How Do Your Numbers Compare to Industry Benchmarks?
Knowing your numbers helps. Knowing if they're good requires context. Industry benchmarks give you that context, but use them smartly. Benchmarks vary by practice area, firm size, market, and competition. A tax firm in Perth will have different metrics than a 50-person commercial law firm in Sydney. Use benchmarks as guides, not absolute targets. These B2B marketing metrics help you understand where professional service firms typically perform.
What's a Good Conversion Rate for Professional Services?
Let's walk through the complete funnel with realistic numbers. Website visitor to lead should be 2-5%, with strong performers hitting 6-8%. Marketing qualified lead percentage should be 25-30% of total leads. Lead to consultation should reach 40-60% for properly qualified leads. Consultation to proposal should hit 50-70% if your discovery process works. Proposal to signed matter should convert at 20-30%, with top firms reaching 40%+.
Here's what this looks like. Say your firm gets 1,000 website visitors monthly. At 3% conversion, that's 30 leads. At 30% MQL rate, that's 9 qualified leads. At 50% consultation rate, that's 4-5 discovery meetings. At 60% proposal rate, that's 2-3 proposals. At 25% close rate, you're signing 1 new client per month. Is that good? Depends entirely on your average engagement value and capacity.
For law firms, Clio's benchmark data shows utilization rates averaging 38% with collection rates around 93%. These numbers connect to marketing. If your pipeline isn't full enough to drive utilization higher, you have a marketing problem. For accounting firms, professional services research suggests targeting 85-90% utilization for billable staff. Significantly below this consistently? You're not generating enough work from marketing. The benchmark that matters most is improvement over time. Are your rates moving up quarter over quarter? That's more important than hitting some industry average.
Quarterly Performance Comparison: The Right Way to Track Progress
Month-to-month numbers are noisy. One big referral or one slow week skews everything. Quarterly comparisons show clearer trends while staying recent enough to act on. Set up simple comparisons. Take your current quarter's KPIs and compare them to the previous quarter and same quarter last year. This accounts for immediate trends and seasonal patterns.
Professional services see seasonal variation. Tax firms get busy January through April. Legal practices may slow in summer. Financial advisors often see year-end spikes. Year-over-year quarterly comparison controls for this. Look for consistent trends across multiple quarters. Website traffic up 15% quarter-over-quarter for three straight quarters? That's real growth, not noise. Lead conversion declining slowly over four quarters? That's a real problem, not just a bad month.
Calculate percentage changes, not just absolute numbers. Going from 20 to 25 leads is a 25% increase. Going from 200 to 205 leads is only 2.5% growth. Context matters. Set realistic quarterly improvement targets. Aiming for 5-10% quarter-over-quarter growth in key metrics is ambitious but doable. Expecting to double your leads every quarter isn't realistic and leads to poor decisions.
The One KPI That Should Keep You Awake at Night
If you only watch one metric closely, make it one of these three. Together they tell you if your marketing is financially sustainable. These are your early warning system. They show problems before they hit revenue.
Cost Per Acquisition: Your Marketing ROI Indicator
Cost per acquisition is simple math. Take total marketing and business development costs. Divide by new clients acquired. Spent $20,000 on marketing last quarter and signed 4 clients? Your CPA is $5,000. Now compare that to average first-year client value. If your typical engagement is worth $25,000, you're in decent shape. Your acquisition cost is 20% of first-year value. That's sustainable. If your typical engagement is worth $8,000, you have a serious problem. You're spending more than half the client's value just to acquire them. You haven't delivered any service yet or covered delivery costs.
Research shows average cost per lead around $200, but cost per client is what matters. For most professional services, healthy CPA is 15-30% of first-year revenue. Rising CPA is your warning signal. If acquisition costs climb while conversion rates stay flat, you're competing in a more expensive market. If costs climb while conversion rates fall, you're in trouble. You're spending more to get worse results. This pattern shows up 3-6 months before serious business problems, giving you time to adjust.
Lead-to-Client Conversion Rate: Your Pipeline Health Check
This metric spans your entire funnel from enquiry to signed matter. It's the percentage of leads that become clients. Generate 100 leads per quarter and sign 10 clients? Your lead-to-client conversion is 10%. For professional services, benchmark data suggests 10-15% is typical. Strong performers hit 20%+.
Why does this matter so much? Because it reflects everything. Lead quality. Qualification process. Sales effectiveness. Service-market fit. Pricing. When this number drops, something in your system is breaking. Maybe marketing brings in lower-quality leads. Maybe your follow-up has slowed. Maybe a competitor just launched and prospects are shopping more. Maybe your pricing is off.
Track this monthly and watch for changes. A steady rate around 12% for six months, then dropping to 8% over two months? That's a clear signal demanding investigation. This metric forces alignment between marketing and business development. Marketing can't just claim "we're generating leads" when conversion drops. Business development can't claim "leads are terrible" when qualification criteria haven't changed. It creates accountability across the entire client acquisition process. If you're concerned about client intake experiences, innovative approaches can help improve this conversion metric.
Marketing Qualified Lead Velocity: Your Growth Predictor
Lead velocity is the rate of change in qualified lead generation month over month. It's forward-looking. If your MQL count grew 20% last month, more opportunities are entering your pipeline. In 2-6 months when those leads convert, you'll see the revenue impact. If your MQL count dropped 20% last month, you just got early warning that revenue might soften next quarter unless you fix it fast.
Calculate MQL velocity as percentage change from last month to this month in qualified leads. Track this as a trend. One month of negative growth isn't a crisis. Three straight months of declining MQL velocity is a five-alarm fire. Professional services firms that track lead velocity can forecast revenue 3-6 months out with decent accuracy. They know their historical conversion rates. Generate 30 MQLs this month and historically 40% book consultations and 25% of those sign? You can predict roughly 3 new clients in the next 90 days. This lets you plan capacity, adjust pricing, and make investment decisions with confidence.
When MQL velocity turns negative, you know immediately to investigate. Is organic search traffic dropping? Are your lead magnets stale? Did a competitor launch a strong campaign? Has your email sequence broken? You can diagnose and fix the problem while you still have pipeline to work with.
Setting Up Your Monthly KPI Dashboard
Tracking all these metrics sounds overwhelming, especially for small firms without marketing staff. But modern tools make this easier than it used to be. You don't need enterprise software or a data scientist. You need a clear framework and consistent measurement. Start with a simple spreadsheet or free tools like Google Data Studio connected to your website analytics, CRM, and email platform.
Focus on core metrics first. If you're just getting serious about marketing, track the top and bottom of the funnel. Website traffic. Leads generated. Consultations booked. Clients signed. Cost per client. Nail the discipline of updating these monthly before adding 15 different metrics. Set a recurring calendar appointment for the first week of each month. Review last month's numbers and update your dashboard. Make this a 30-minute partner meeting. Review trends. Celebrate wins. Flag concerns. This consistent rhythm matters more than sophisticated analysis. Understanding UX problems users can't tell you about helps you interpret what your digital marketing metrics are really telling you about user experience.
Who owns this in your firm? For firms under 30 people, it's often a partner handling marketing oversight. For firms 30-100 people, you might have a marketing coordinator who compiles numbers for partner review. Either way, establish clear ownership. Nothing kills KPI tracking faster than diffused responsibility where nobody updates the numbers. Connect your metrics to decisions. This isn't a reporting exercise. It's a management tool. If lead-to-client conversion drops two months in a row, what's your protocol? Schedule a pipeline review? Audit your qualification process? Survey recent non-converts? Define trigger points that demand action. Managing marketing projects requires systematic approaches to avoid overwhelm. Most importantly, share the numbers with your team. Marketing performance isn't a secret. When everyone understands what's working, they can contribute ideas and take ownership of improvement.
Conclusion
Marketing effectiveness isn't mysterious. It's measurable. The firms that grow consistently aren't the ones with the biggest budgets or flashiest campaigns. They're the ones who know their numbers, understand what drives results, and make decisions based on data instead of gut feel. Start with the metrics that matter most for where you are today. Building awareness? Focus on traffic and engagement. Generating plenty of leads but not closing them? Focus on conversion and qualification. Signing clients but acquisition costs are too high? Focus on efficiency. You don't need perfect data to start making better decisions. You need consistent measurement and honest assessment of what works. The firms that embrace this discipline pull ahead of their competition not overnight, but consistently, quarter after quarter.
Ready to Get Your Marketing Numbers Under Control?
Not sure if your marketing is performing where it should be? Request a marketing audit and we'll help you identify exactly where your funnel is breaking and what to fix first.
Frequently Asked Questions
How many marketing KPIs should a small professional service firm track?
Focus on 8-10 core KPIs that cover each stage of your marketing funnel. Start with website traffic, lead generation rate, lead quality percentage, consultation conversion rate, and cost per acquisition. These five metrics alone will give you visibility into awareness, lead generation, qualification, conversion, and financial efficiency. Once you have a consistent rhythm tracking these, expand to include channel-specific metrics and engagement indicators. The mistake most firms make is trying to track 25 different metrics right out of the gate and then giving up after two months because it's too much overhead. Start simple and expand gradually as tracking becomes habitual.
What's a realistic marketing budget for professional service firms?
B2B professional service firms typically invest 8-10% of revenue in marketing according to Forrester research, with high-growth firms sometimes reaching 12-15%. But the percentage matters less than the ROI you're generating. If you're spending 5% of revenue on marketing but your cost per acquisition is 40% of first-year client value, you're actually overspending because the unit economics don't work. Conversely, if you're spending 15% on marketing but your CPA is 15% of client value and you have strong lifetime value, you should probably invest more because you've found a profitable growth engine. The key is measuring ROI at each funnel stage and being willing to shift budget to channels and tactics that demonstrate clear returns.
How long does it take to see results from professional services marketing?
Most professional service firms see initial traction within 3-4 months, with significant momentum building after 6-9 months. The sales cycle averages 2-6 months depending on service complexity, which means the leads you generate today won't typically convert for several months. This lag time frustrates many firms who expect immediate results. Content marketing and SEO take even longer to show results, often 6-12 months before you see meaningful organic traffic growth. Paid advertising can generate leads faster, sometimes within weeks, but still faces the same sales cycle delay before leads convert to clients. The key is maintaining consistent effort while tracking leading indicators like website traffic growth and lead generation that predict future revenue even before you see it in signed engagements.
Which marketing channel generates the best ROI for professional services?
Referrals typically convert best with 30-50% conversion rates according to multiple industry studies, followed by SEO and content marketing at 2-5% website conversion. However, a diversified approach prevents over-reliance on any single channel. Referrals are highest converting but hardest to scale systematically. You can't simply decide to get 50% more referrals next quarter. SEO and content marketing take longer to build but create compounding returns. A strong article can generate leads for years. Paid advertising offers volume and speed but at higher cost per lead. The best approach is tracking ROI by channel and investing proportionally to what works while maintaining presence across multiple channels to avoid vulnerability if any single source dries up.
Should I compare my KPIs to last month or last quarter?
Compare both but use them differently. Month-over-month shows immediate trends and helps you catch problems quickly. If website traffic drops 35% from one month to the next, you want to know right away, not three months later. But monthly comparisons are noisy because professional services often see natural variation from one month to another. Quarter-over-quarter comparisons smooth out this noise and show sustainable trends. They also make seasonal patterns more visible. Comparing Q4 2025 to Q4 2024 tells you whether you've grown year-over-year while accounting for seasonal factors. Use monthly data for early warning signals and quick course corrections, use quarterly data for strategic assessment and trend analysis.